
If you report to many audiences, you have probably built the same report more than once. Agencies build one report per client. Consultancies build one report per engagement. Internal analytics teams build one report per business unit, brand or market. Each copy begins as a reasonable response to a real difference, and each copy becomes one more place for a definition to live.
The standard answer is a metrics layer: define each metric once and make every dashboard read that definition. The design in this article contains one. A metrics layer assumes one organization, one vocabulary and one set of data. A hundred unrelated clients sharing one model is a different problem. Each of them calls the metrics by its own names, sends its own data and keeps its own calendar, and none of them may have the shared model changed on its behalf.
I designed a system for that case on the analytics team of an agency that bought podcast, radio, YouTube and other media for its clients. About ten analysts each carried between eight and twenty accounts, every account had its own report, and the only plan for growth was another analyst for every ten new clients. What replaced that was one data model, one metric catalog, one report template, and a short settings record per client. The same template ended up serving more than a hundred clients. This article builds the design up one complication at a time. Everything in it runs in a small companion repository with synthetic data and three fictional clients.
Contents
The fixed model
Start with the easy case: ten clients, all watching cost per acquisition (CPA), which is spend divided by conversions. Ten reports with ten CPA formulas work until the definition changes and one copy is missed.
The alternative is one table. Every client’s data lands in it, with the same columns, at the same level of detail:
|
date |
client |
campaign |
channel |
spend |
impressions |
sessions |
conversions |
revenue |
|---|---|---|---|---|---|---|---|---|
|
2025-01-06 |
brewbox |
brewbox_podcast |
podcast |
2,314.36 |
92,574 |
303 |
24 |
|
|
2025-01-06 |
pulsefit |
pulsefit_social |
social |
2,523.01 |
280,334 |
75 |
||
|
2025-01-06 |
juniper |
juniper_social |
social |
2,965.83 |
329,536 |
1,946 |
165 |
16,711.35 |
Three rows of the synthetic data in the companion repository. The empty cells are deliberate.
This is a fact table at the center of a dimensional model: one row per client, campaign, channel and day. That fixed level of detail is the grain. Everything that follows depends on it, and it is the first decision I would make in any new reporting system.
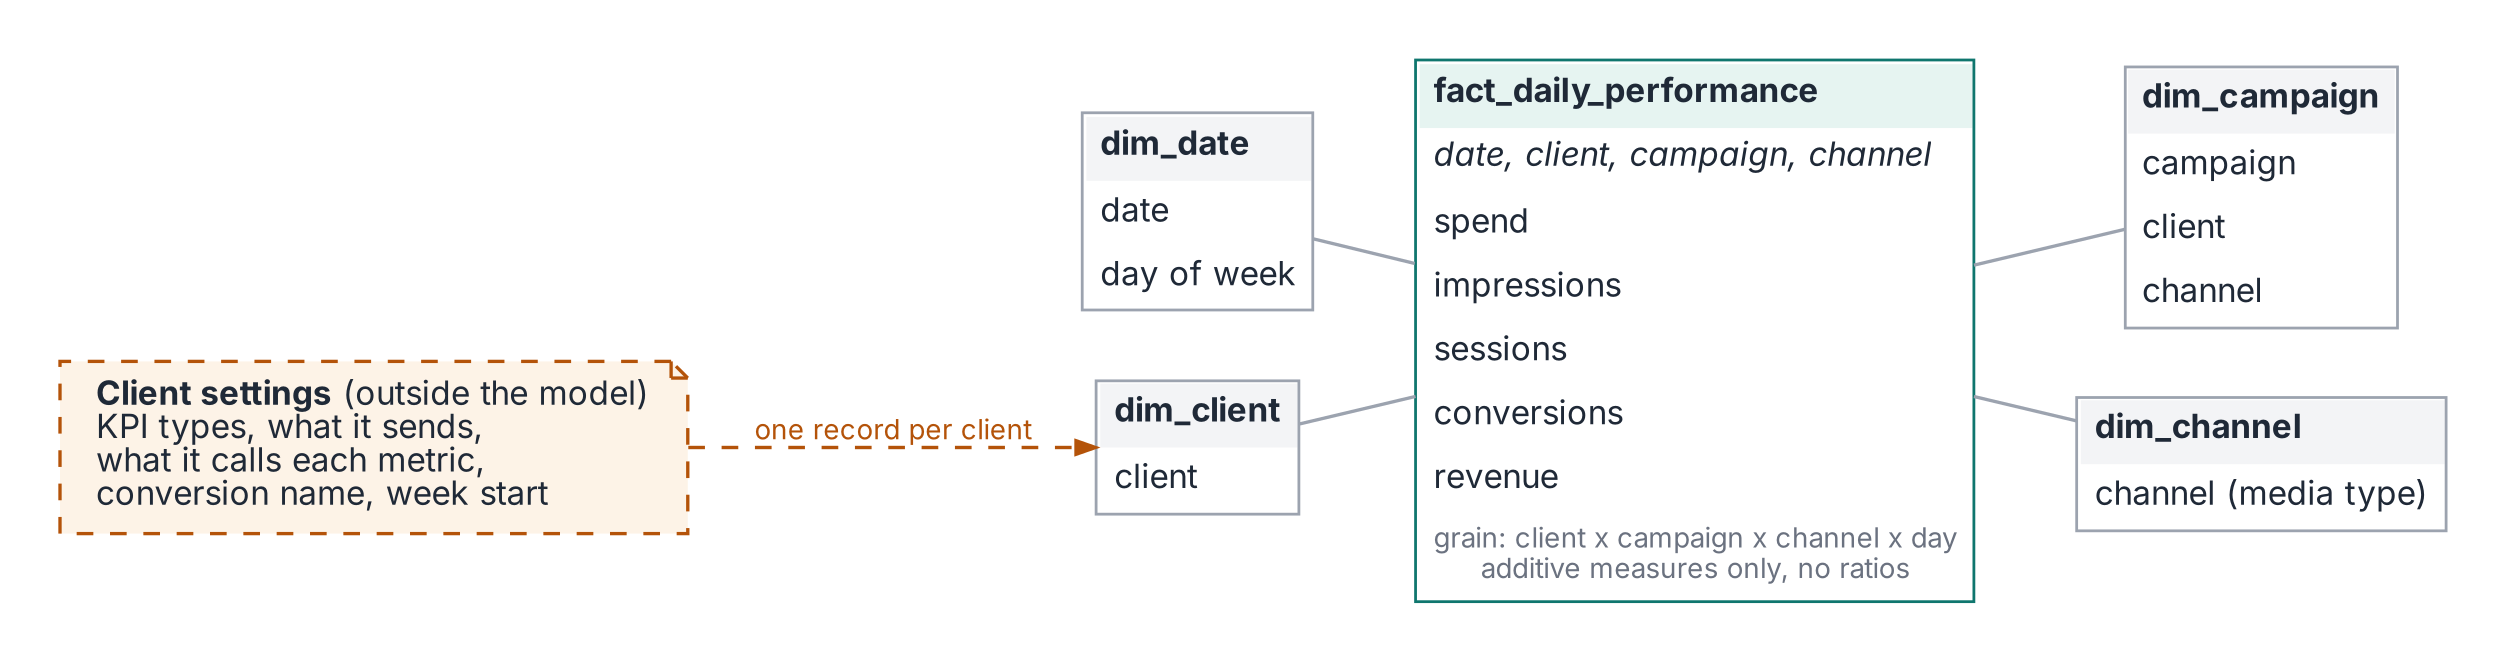
CPA is now defined exactly once:
The client is a filter. In the original system the report template’s load script had a single where client = ... clause. Changing that one value switched every chart and every label to another client.
Same math, different names
The first complication arrives before the tenth client does. Clients agree on the math far more often than they agree on the words. One client’s CPA is another client’s CPO, cost per order. One client calls traffic sessions, and another calls it visits. One client calls revenue divided by spend ROAS, and another calls the same number ROI.
The reverse happens too. “Acquisition” meant a completed order for one client, a checkout started for another, and a site visit for a third. “ROI” meant revenue over spend for one client and profit over spend for another. An analyst covering a colleague’s account could apply the wrong definition without knowing it.
If the name lives inside the formula, every renaming becomes a new metric and the copies drift apart. So I separated the two. The definition lives once, in the catalog. The name lives in the client’s settings. At onboarding, every KPI gets two questions: how do you calculate it, and what do you call it? The first answer maps to an existing definition, or becomes a new one, once, for everyone. The second answer becomes a label:
BrewBox’s report says “Cost per Trial” and “Visits” over the same SQL every other client gets. Whatever a client’s primary outcome is, trial, install or order, it lands in one generic conversions column, and the record supplies the word. The {conversion} placeholder in the catalog is filled from this record, which is how BrewBox gets Cost per Trial. A client that wants revenue over spend shown as “ROI” gets a label on roas. A client that means profit over spend gets a different definition, roi. Two clients can both see a column called ROI and get different math, as long as the catalog knows which is which. The reporting week is in the record too, because a weekly number on the wrong week is a wrong number. The sends line is the subject of a later section.
This is where the design parts ways with a plain metrics layer. A metrics layer gives a metric one name. This gives it one meaning and as many names as there are clients.
What if some clients watch different KPIs?
Client eleven is an online store. It watches return on ad spend. Building a second report would start the copies again.
So the report stops naming metrics. The template asks for “KPI 1” through “KPI N”, and each client’s settings decide what fills each slot. The catalog groups metrics into templates by goal: the CPA template is spend, conversions, CPA, sessions and conversion rate; the ROAS template is spend, revenue, ROAS, conversions and average order value.
A client picks one or more templates, and a small piece of code between the template and the database, the resolver, merges them in order and drops duplicates. The first version of this system picked one template per client and handled the few clients that wanted both by hand. Merging makes “both” an ordinary case.
Unused slots never appear as empty columns. In the BI tool, each KPI column carried a “show column if” condition that read the client’s settings, so a client using three of ten slots saw three columns, not ten.
What if clients send different data?
This was the hardest problem in practice and the one I see discussed least.
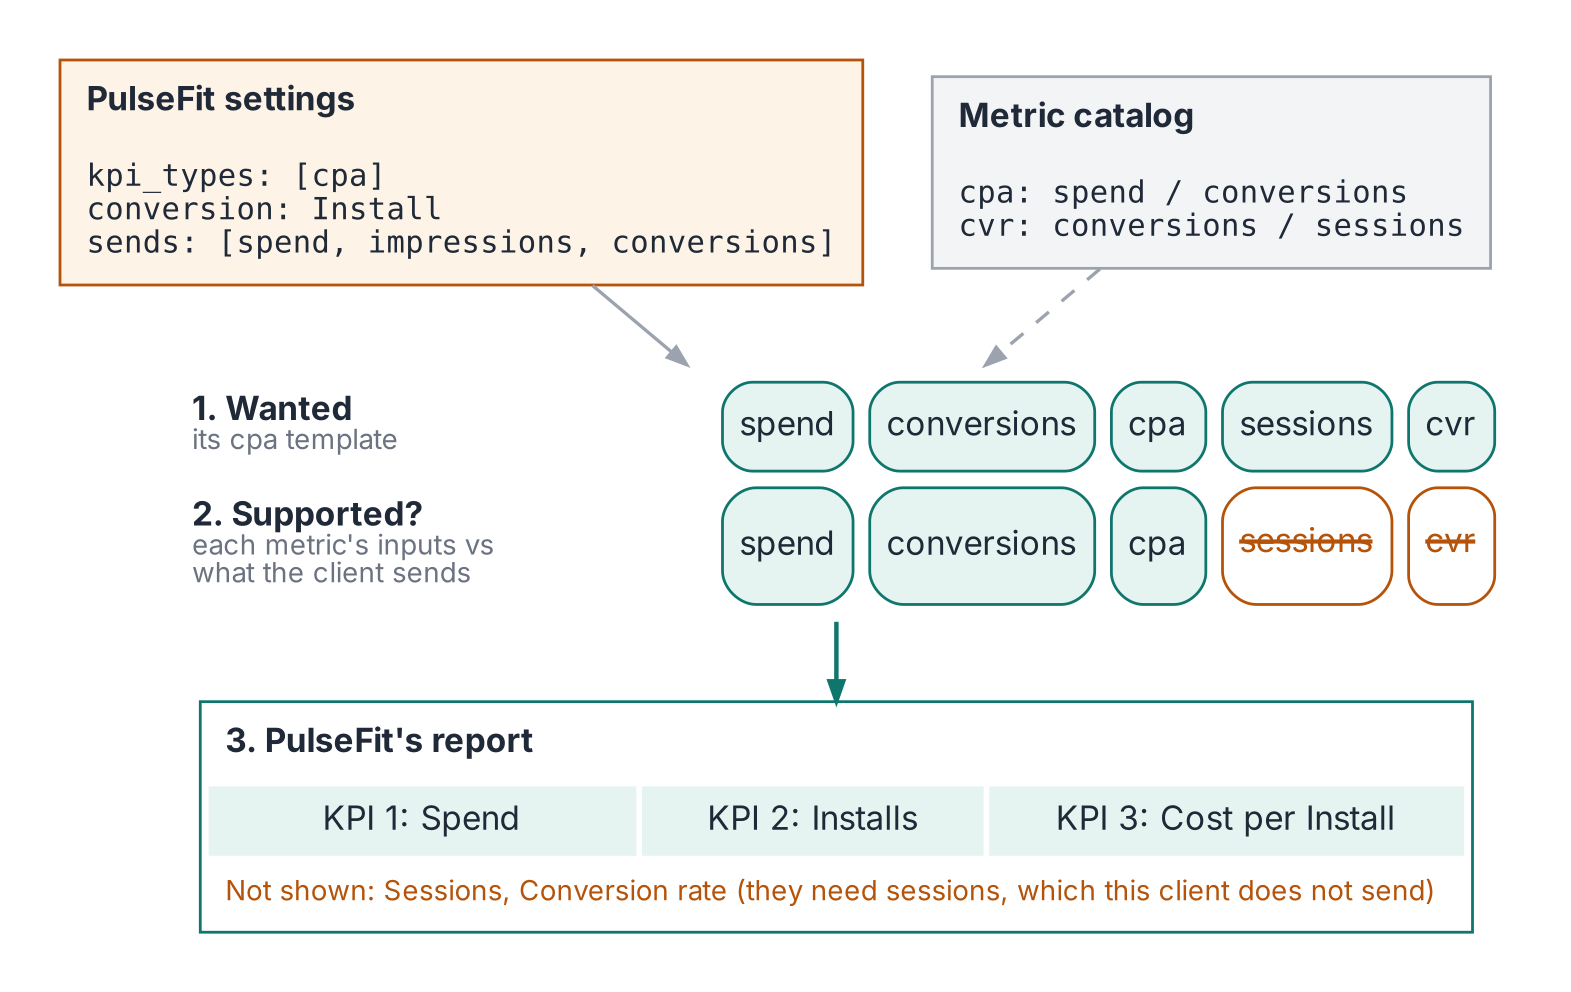
A third party does not own its clients’ data. Spend and impressions come from the buyer’s own booking records, so every client has them; they are listed under sends anyway, so the availability check has one rule. Performance data comes from the client, and the client decides what to send. One client sends orders and nothing else. Another sends orders, sessions and revenue. An app client has installs but no website sessions at all.
The CPA template includes conversion rate, which is conversions divided by sessions. What should it show for the client with no sessions? Zero would be wrong, because zero means measured and found to be zero. An error message has no place on a client-facing report. A separate template for every combination of data is where the old approach was heading.
Two declarations fix it. Every metric declares what it is made of:
Every client declares what it sends; that is the sends line in BrewBox’s record. The resolver checks each wanted metric against that list. Supported metrics take a slot. The rest are left off, and the report says why:
When a client asks why conversion rate is missing, the answer is on the page, and it points at the data rather than at the analyst. It also turns a complaint into a request: send sessions, and conversion rate appears, with no new report and no code change.
The same declaration standardizes intake. Once the model says what it needs, a new client can be told exactly what shape to send.
The ratio trap
The fact table has no CPA column, no ROAS column and no conversion rate column. That is the one rule I would keep if I had to throw everything else away: store the parts, never the ratio.
|
Day |
Spend |
Conversions |
CPA |
|---|---|---|---|
|
Monday |
$1,000 |
50 |
$20.00 |
|
Tuesday |
$1,000 |
10 |
$100.00 |
Average the daily CPAs and you get $60. Divide total spend by total conversions and you get $33.33, which is the campaign’s actual CPA. The average weights a 10-conversion day the same as a 50-conversion day. Every ratio is therefore computed as sum(numerator) / sum(denominator) after grouping, at whatever level the report asks for. Day, week, channel or whole quarter, the definition is the same and the number is right. The whole family of “why doesn’t the weekly number match the daily numbers” questions goes away. In the original system these ratios were expressions in the dashboard. The dataset held only raw measures.
What if the data arrives at a different grain?
Everything so far assumes one row per client, campaign, channel and day, and the design worked because nearly every source fit that grain. When a source does not, the same approach applies with one more table. The usual case is a radio vendor that sends weekly totals. The weekly source gets its own fact table on the same dimensions, reports roll the daily table up to weeks and combine the two at the coarser grain, and the report says it goes no finer than a week.
Two rules keep this honest. A weekly total is never spread across days, because that invents detail nobody measured. And a weekly source whose weeks do not start on the client’s week start fails the build, because no query can realign those totals without guessing. Measures that do not add, unique reach above all, sit outside the pattern entirely and must be computed from source at the level requested.
Where it fits
This fits any team that produces the same kind of report for many audiences that each want their own numbers in it, as long as the audiences share a grain and a core set of measures and differ mainly in vocabulary, KPI selection, data availability and calendar. Keep N small; an audience that needs something truly custom should get a custom page of its own. And treat configuration as a product: once a record changes a client’s numbers, it needs validation, an owner and a history.
What it did in production
Building a client’s dashboard became a configuration change, and build time fell by roughly 70%, from hours to minutes. Weekly reporting work fell by about a third. The same template served more than a hundred clients.
Two effects mattered as much as the time saved. Definitions stopped drifting, and nearly any analyst could pick up nearly any account, because everything account-specific was written down in the settings record. And because the record was a table, it joined to the performance data. Questions that used to depend on memory, such as which clients in an industry tracked orders and how quickly their campaigns saturated, became a filter on the settings followed by one query.
What I would change today
Keep configuration in version control. The original settings lived in the CRM, where the account information already was, and analysts edited them there. A record that changes a client’s numbers deserves a diff, a review, and a check against the data it describes. The repository warns when a record and the data disagree about what a client sends.
Declare inputs from the start. The first version already hid unused slots, but deciding which KPIs a client’s data could support was still a judgment made at setup. Declaring each metric’s inputs turns that judgment into a rule, and the “Not shown” list says why.
Use a mature semantic layer at scale. Defining metrics once and resolving them per context is now a product category. A large team starting fresh should start there. A small team still gets most of the benefit from one fact table, one metric file and one record per client. Either way, the hard parts are the same: decide the grain, declare what each metric is made of, and be explicit about what each audience actually sends.
Conclusion
The design scaled because it separated what every client shares, which belongs in one model and one catalog, from what makes each client different, which belongs in a small, explicit record. Start with the grain. Store the parts and compute the ratios. Make each audience’s differences a few lines of configuration. Then onboarding the next client means writing a record.
Try it yourself
The companion repository, config-driven-reporting, has a synthetic data generator, the shared model, the metric catalog, the KPI templates, settings for three fictional clients and one report template:
BrewBox tracks CPA on a Monday week and calls its sessions visits. PulseFit tracks CPA, has no session data, and has a radio source that only arrives weekly. Juniper tracks ROAS and CPA together under its own names. Add a fourth client to config/clients.yaml and the same template produces its report.
All images, unless otherwise noted, are by the author.
···
Val Ye is a Lead Business Intelligence Engineer in the streaming industry. She designed the architecture described here while at a media buying agency.