
On the night of 18 August 1913, the story goes, a roulette ball at the Casino de Monte-Carlo landed on black 26 times in a row. Somewhere around the tenth black, gamblers started piling money onto red, sure that a streak that long had to break. It didn’t, and the usual retelling is that they lost millions of francs. The details vary from one retelling to the next, so I’d treat the exact numbers loosely. The mistake behind the story is real enough to have a name: the gambler’s fallacy.
Humans make it constantly. I wanted to know whether language models do, and I wanted to know in a way that doesn’t depend on how politely a chat model answers a trivia question. Asking “is a coin due for tails after five heads?” tests what a model says. Reading its next-token probabilities tests what it expects. Those two can come apart in interesting ways.
Contents
Why the coin can’t be due
Take a fair coin. The chance of five heads in a row is 1/32:
The chance of five heads followed by a tail is 1/64, which is exactly half of that. So if you’ve just watched five heads happen, the chance the next flip is a tail is
The streak is the rare part. Once it has happened it is just history, and the coin has no way of reading it. The same calculation works for any streak length: the rarity of the run (here 1/32) always cancels against the rarity of the run plus one more flip, and what’s left is 1/2.
It still feels wrong, and that feeling has been studied for a long time. Tversky and Kahneman called the underlying habit a belief in “the law of small numbers”: people expect even short sequences to look like the long-run average, so a run of heads feels like it has put the coin in debt [2]. It isn’t only a classroom effect. Chen, Moskowitz and Shue found negatively autocorrelated decisions, unrelated to the merits of the cases, among asylum judges, loan officers and baseball umpires, and they read it as consistent with the gambler’s fallacy [1].
A rule of thumb that is not a fallacy
There is one catch that matters for the experiment. All of the above assumes you know the coin is fair. If you don’t, a streak is evidence.
The classic way to formalize “I know nothing about this coin” is Laplace’s rule of succession: after h heads in n flips, estimate the chance of heads next as
After five heads in five flips that is 6/7, about 86%. An observer who starts with no opinion about the coin should expect the streak to continue, because five heads in a row is what a heavily biased coin would produce. So a model that expects repeats after a streak isn’t automatically committing a fallacy. It might just be reasoning about an unknown coin.
That’s why I ran every test twice: once with the coin left undescribed, and once with the prompt saying outright that it is a fair coin and that flips are independent. In the second version the correct answer is 1/2 at every streak length, with no wiggle room.
What’s been done, and the gap I’m poking at
I’m not the first to point language models at coin flips. Bigelow and colleagues studied in-context learning on random binary sequences and found gambler’s-fallacy-like patterns, with more alternation than chance, in sequences generated by some GPT models [3]. Van Koevering and Kleinberg compared the coin flips LLMs produce with the sequences humans write [4]. Mondal and colleagues made the case that a model’s stated answer and the probabilities it computes can disagree, which they call revealed beliefs versus stated answers [5].
As far as I could find, though, nobody had put those pieces together on the specific question here: given a genuinely random sequence, how does the model’s probability for the next flip move as the streak grows, does telling it the coin is fair fix that, and does it match what the same model says when asked directly? That’s what I measured.
How to read a model’s belief about a coin
A language model doesn’t output “heads” or “tails”. It outputs a probability for every token in its vocabulary. If I end a prompt right after a run of flips written as H T T H H, the model’s probabilities for the tokens H and T are its guess for the next flip. Renormalizing over just those two gives a number I can read directly: the model’s probability of heads.
There’s a convenient trick. A model reads a sequence left to right, so a single forward pass over a whole sequence produces a probability for the flip at every position, each one based only on the flips before it. I generate a random sequence with NumPy, feed it in once, and read off the model’s belief before every single flip.
Here is the core of it:
The sigmoid of the difference between the two logits is the probability of heads after renormalizing over H and T. The slice len(base) - 1 : -1 picks the positions that predict flips 0, 1, 2, and so on.
Then I group those probabilities by how long the streak was just before each flip, and turn them into “probability that the streak continues”:
Average p_repeat within each streak length across many sequences and you have a curve. Because the sequences are truly random, the true answer is 0.5 at every streak length. Anything else on that curve is the model’s own prior leaking through, since there is nothing in a random sequence for it to have learned.
One sanity check matters here. If a model puts most of its probability on some other token, say a newline or the word “The”, then the renormalized H versus T number is measuring a sliver of its attention. So I record how much total probability lands on H and T for every model and prompt.
The experiment
I used four open model families, each as a base model and as the instruction-tuned version: Qwen2.5 (1.5B and 3B), SmolLM2-1.7B and OLMo-2-1B. Comparing base and instruct is deliberate. Instruction tuning is the stage where models are trained to be sensible and helpful, and I wanted to see whether it removes a bias, adds one, or does nothing.
For each model I generated 1,200 random sequences of 60 fair flips, shared across models so every model sees identical data. That gives 59 predictions per sequence, and the curves average them by streak length, with 95% confidence intervals from resampling whole sequences.
There are three tests.
The first is the main one: the streak curves, under two prompt headers. The plain header says only “Here is a record of coin flips (H = heads, T = tails):”. The fair-coin header says the coin is fair and each flip is independent of the ones before it.
The second compares saying with doing. To get what a model says, I asked a multiple-choice question: a fair coin (or an idealized roulette wheel) has just landed the same way k times in a row, for k from 3 to 12, and the model chooses among “less than 50%”, “exactly 50%” and “more than 50%” for the chance of another repeat. I shuffled the order of the options, since models have letter preferences. To get what the instruct models do, I showed 24 random flips ending in a planted streak of a chosen length and asked for the next flip, in the model’s chat format, then read the probabilities of H and T in the answer slot.
The third is a learnability check. I made two more kinds of data, one where each flip repeats the previous with probability 0.7 and one where it repeats with probability 0.3, so streaky and alternating coins. If a model’s behavior on the fair coin is a stubborn prior, it should fail to adapt to these. If it’s just a default that evidence can override, it should follow the data.
What the models expect after a streak
Figure 1 is the central result. The dashed line is the right answer for a fair coin. The dotted line, in the top row, is what an ideal learner with no opinion about the coin would expect, so it shows how far above 0.5 a streak could justify going if you didn’t know the coin was fair.
Most of these models do not fall for the gambler’s fallacy. For long streaks they do roughly the opposite. In all eight models the probability of a repeat climbs once the streak passes about four flips, and after ten or more identical flips it is 0.81 (base) and 0.82 (instruct) for Qwen2.5-1.5B, 0.71 and 0.71 for OLMo-2-1B, 0.64 and 0.67 for Qwen2.5-3B, and 0.60 and 0.59 for SmolLM2-1.7B. The correct value is 0.50.
The short end of the curve is more mixed. For streaks of one to four flips, the Qwen models stay between 0.47 and 0.58. SmolLM2 and OLMo-2-Instruct dip below 0.5: SmolLM2-Instruct falls to 0.40 at a streak of three, and OLMo-2-Instruct sits at 0.43 at streaks of one and two. That is a small, gambler’s-fallacy-style lean toward alternation, and it reverses as the streak grows.
Part of the upswing is defensible. On these same sequences, an observer who knows nothing about the coin (the dotted line) should expect about 0.60 at a streak of six and 0.67 at ten or more. Qwen2.5-3B and SmolLM2 stay at or below that line. Qwen2.5-1.5B overshoots it by about 14 points at ten or more. Instruction tuning changes little: the base and instruct curves nearly coincide for both Qwen models, and the biggest differences are in OLMo-2 and SmolLM2 at short streaks.
The second row is the stricter test. There the prompt says the coin is fair and the flips are independent, so the ideal learner’s room to go above 0.5 is gone.
Saying the coin is fair helps only a little. At ten or more flips, Qwen2.5-1.5B goes from 0.81 to 0.77 (base) and from 0.82 to 0.79 (instruct), Qwen2.5-3B from 0.64 to 0.58 and from 0.67 to 0.62, and OLMo-2-1B barely moves (0.71 to 0.70 base, 0.71 to 0.68 instruct). SmolLM2-Instruct goes the wrong way, from 0.59 to 0.61. With 0.50 as the right answer, every model is still at least seven points above it at ten or more flips, and the curves keep their shape.
One more number: the models are lopsided before they have seen a single flip. The probability of heads on the first flip ranges from 0.59 to 0.99 across the eight models and two prompts. My header lists heads first, which may be part of the reason, but I didn’t test the header order.
What they say versus what they do
Figure 2 puts the two measurements side by side. On the left, each model’s answer to the direct question, averaged over the coin and roulette versions and over the streak lengths. On the right, the probability the chat version assigns to the streak continuing when it has to predict the next flip.
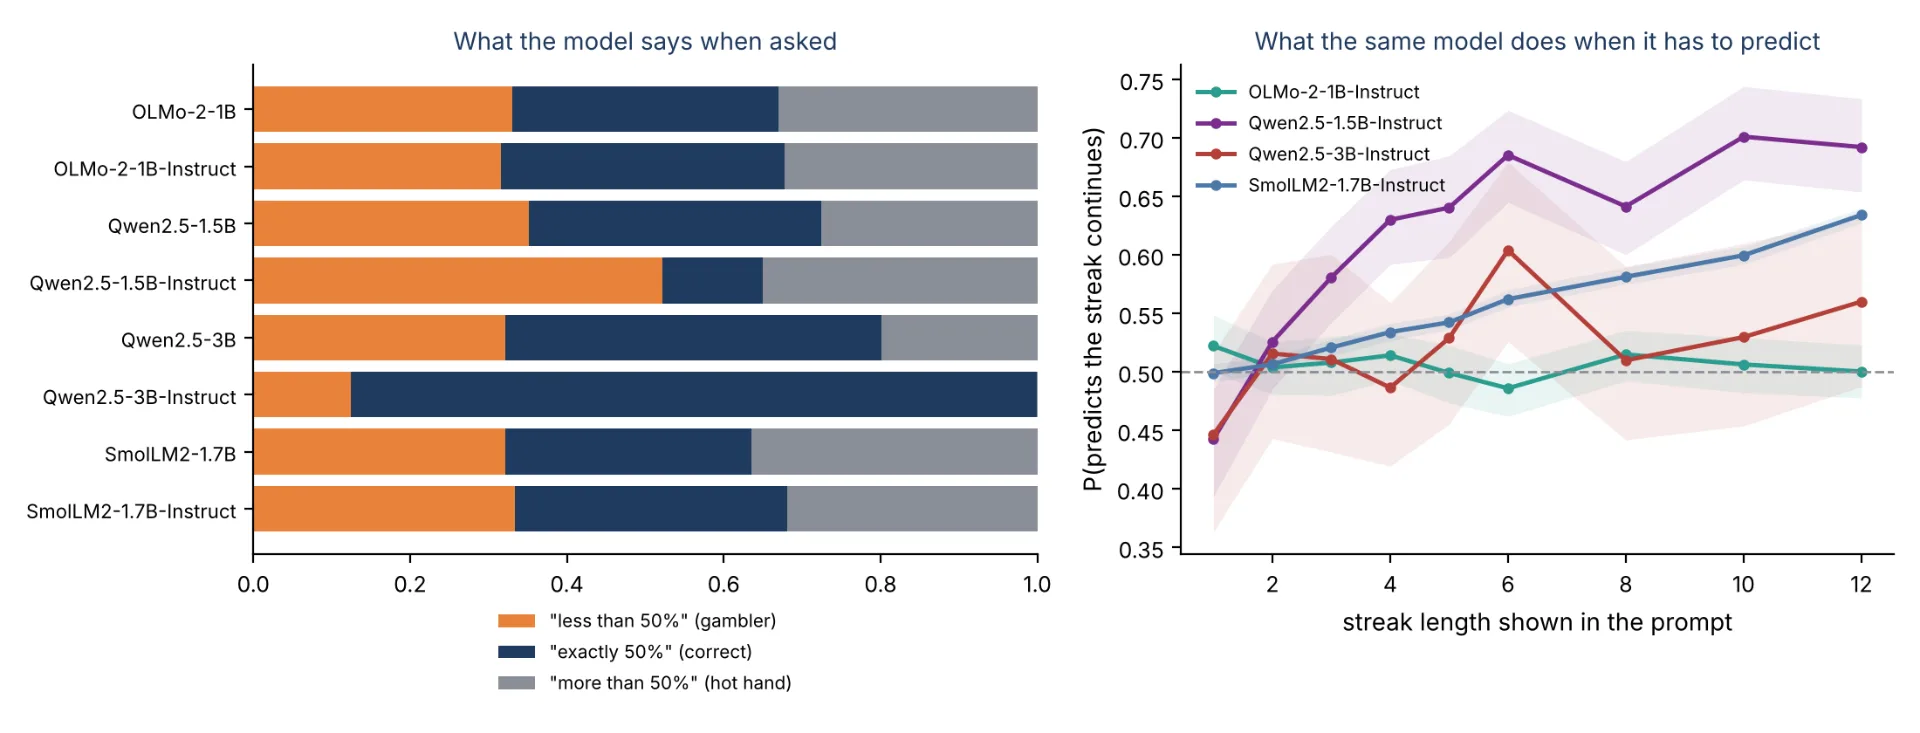
What the models say is inconsistent. Qwen2.5-3B-Instruct is nearly perfect: 88% on “exactly 50%” overall and 100% on every coin question, though it slips on roulette, where it puts 7% to 33% on “less than 50%”. Qwen2.5-1.5B-Instruct is the opposite: 52% on “less than 50%”, the gambler’s answer, and only 13% on the right one. OLMo-2-1B-Instruct spreads its probability almost evenly (32%, 36%, 32%), so it isn’t really answering the question. The base models and SmolLM2-Instruct put only 18% to 53% of their probability on the three answer letters, so I’d treat their answers as weak evidence.
What the instruct models do is a different story. After a planted streak of twelve, Qwen2.5-1.5B-Instruct expects it to continue 69% of the time, SmolLM2-Instruct 63%, Qwen2.5-3B-Instruct 56% (interval 0.49 to 0.63) and OLMo-2-Instruct 50%. Compared with the plain-text version in Figure 1, the chat format softens the effect for three of the four, but it doesn’t remove it for Qwen2.5-1.5B or SmolLM2.
The sharpest mismatch is Qwen2.5-1.5B-Instruct. Asked in words, it leans toward “less than 50%”, the gambler’s answer. Asked to predict, it leans toward the streak continuing. Its answers and its probabilities point in opposite directions.
Can they learn a streaky coin?
Figure 3 averages the model’s expected repeat rate over every position and plots it against how often the data really repeats. A model that tracks the data would follow the diagonal.
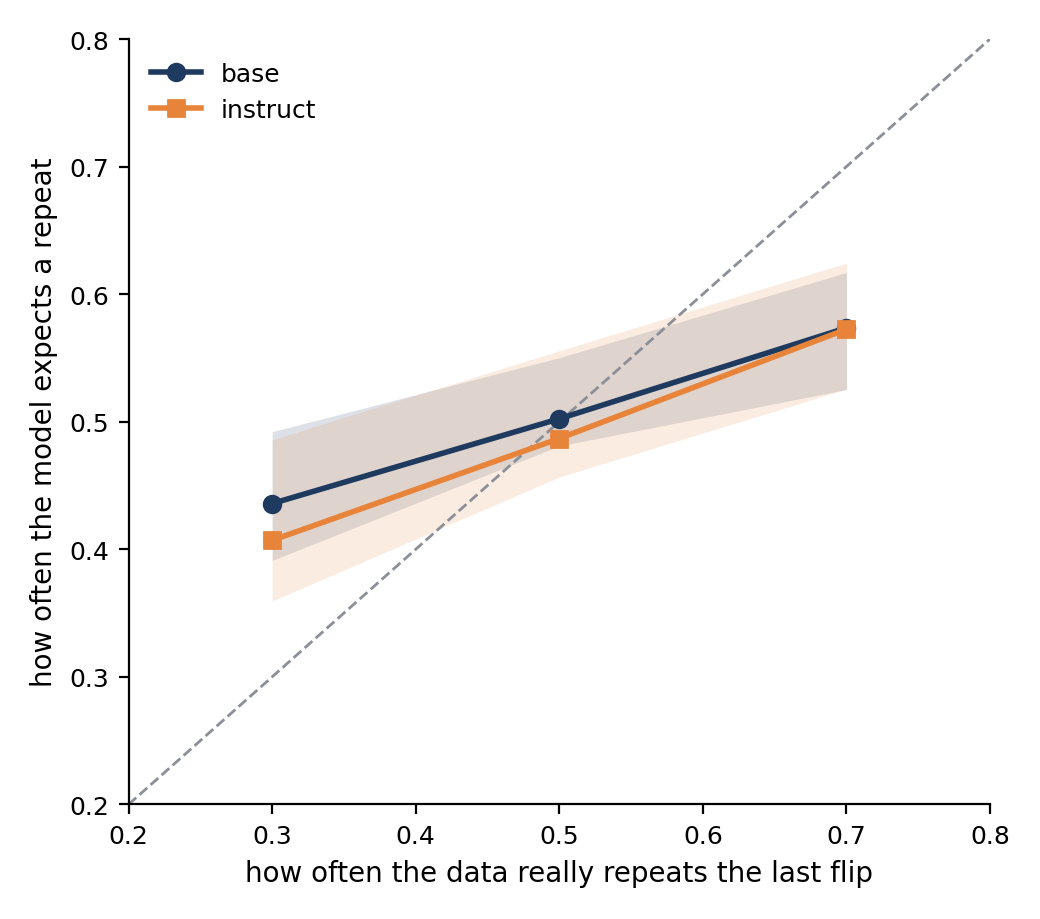
All eight models move in the right direction, and none moves far enough. Between a coin that repeats 30% of the time and one that repeats 70% of the time, the true repeat rate rises by 0.40. The models’ expected repeat rate rises by 0.09 (SmolLM2-1.7B) to 0.22 (OLMo-2-1B-Instruct). So they do pick up on the data, at between a fifth and a little over half of the right volume. On the fair coin, the eight models’ averages range from 0.46 to 0.56.
Position in the sequence matters too. In the first ten flips, all eight models lean toward alternation: the average probability of a repeat is between 0.37 and 0.47, below 0.5 every time, which echoes the alternation Bigelow and colleagues found in generated sequences [3]. From flip 11 it recovers, and for Qwen2.5-1.5B it overshoots (0.57 to 0.59 for flips 21 to 59). As a sanity check, the probability on the two answer tokens, H and T, is between 0.85 and 0.96 in every setting, so these curves are not an artifact of a model wanting to say something else.
Caveats
These are small open models, up to about three billion parameters. The method needs exact next-token probabilities, which most hosted frontier models don’t expose, so I can’t say what the largest chat models do internally. Everything here is coin flips written as single letters; a model might behave differently on a story about a basketball player or a roulette table. The probabilities depend on prompt wording, which is why I used two headers and shuffled the answer options instead of trusting one phrasing. The multiple-choice results are shaky for several models, because the base models and SmolLM2-Instruct put much of their probability on tokens other than the three letters. And the explanation I offer below for the long-streak effect is a guess I didn’t test.
What I take from it
Do LLMs fall for the gambler’s fallacy? Mostly not, and for long streaks they do the reverse. The early part of a sequence shows a small pull toward alternation, but as streaks grow, the expectation of a repeat climbs in all eight models, and at ten or more flips it is 0.60 to 0.82 where 0.50 is right. Telling the model the coin is fair trims that by a few points at most. Instruction tuning changes little overall, and the models do pick up on a streaky or alternating coin, but at a fraction of the right strength.
I can only guess at the cause. Language models are pulled strongly toward continuing patterns that are already in their context, and a streak is the most repeatable pattern there is. That would make this a copying habit more than a belief about coins, but I didn’t test it, so take it as a hypothesis.
The mismatch between words and probabilities matters more in practice. Qwen2.5-1.5B-Instruct leans toward the gambler’s answer when asked and toward continuation when predicting. If you use a small model to forecast or simulate anything sequential, its probabilities may carry a prior about streaks that its written answers never mention.
···
References
[1] Chen, Moskowitz, Shue, Decision-Making Under the Gambler’s Fallacy: Evidence from Asylum Judges, Loan Officers, and Baseball Umpires (2016), The Quarterly Journal of Economics 131(3), 1181–1242
[2] Tversky, Kahneman, Belief in the Law of Small Numbers (1971), Psychological Bulletin 76(2), 105–110
[3] Bigelow, Lubana, Dick, Tanaka, Ullman, In-Context Learning Dynamics with Random Binary Sequences (2023), arXiv:2310.17639
[4] Van Koevering, Kleinberg, How Random is Random? Evaluating the Randomness and Humaness of LLMs’ Coin Flips (2024), arXiv:2406.00092
[5] Mondal, Dolamic, Bovet, Cudré-Mauroux, Audiffren, Do Large Language Models Exhibit Cognitive Dissonance? Studying the Difference Between Revealed Beliefs and Stated Answers (2024), arXiv:2406.14986